How peptide purity is measured: HPLC-UV, mass spectrometry, and what each method proves
Purity is not a number a machine prints. It is the output of a specific method with specific limits — and the same vial can give different answers depending on which one you ask. Here is the method-by-method picture, from the analytical literature.
30 September 2026 · 6 min read
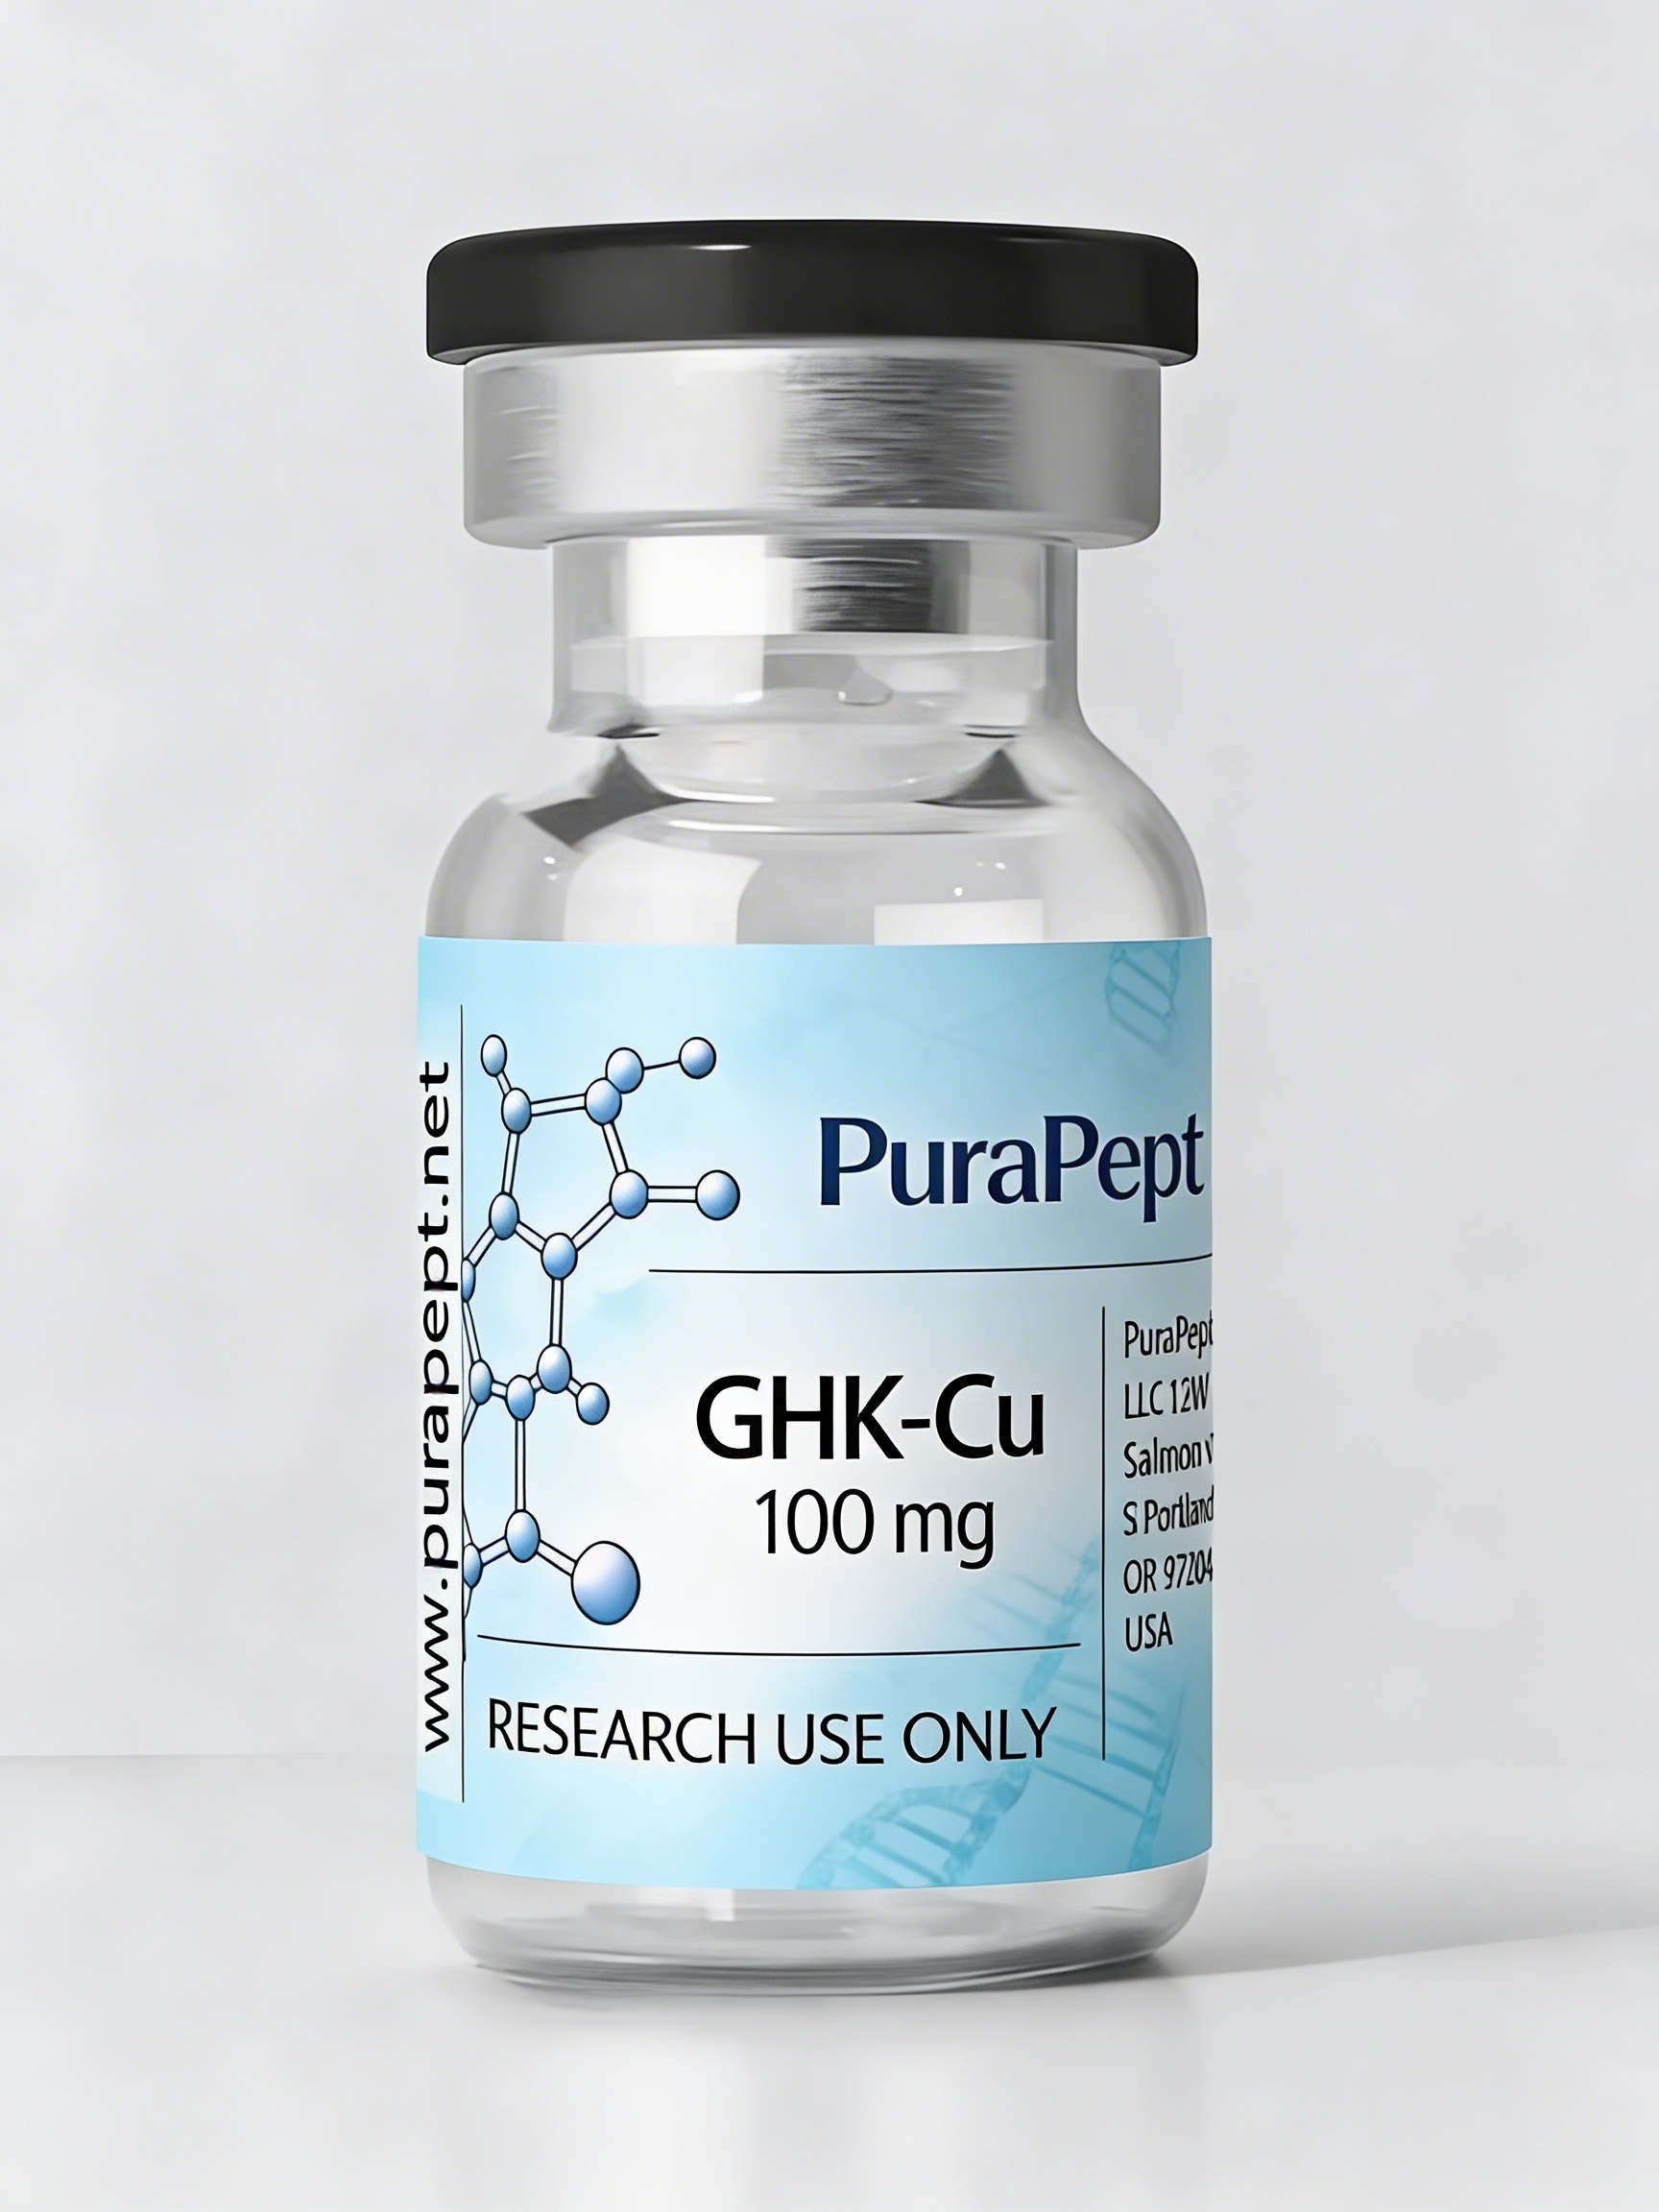 GHK-Cu 100 mg
“Purity” is the most quoted number in this field and the least understood. A chromatogram says one thing, a mass spectrum says another, a gravimetric balance says a third, and all three can be correct. What changes between them is not the vial. It is the method, the standards, the calibration and the detection limit. So this page takes the methods one at a time and states, for each, what it establishes and what it structurally cannot.
Reverse-phase HPLC with UV detection — the default, and its ceiling
The workhorse is reversed-phase HPLC with UV detection, and peptides are usually read at low ultraviolet wavelength where the peptide bond absorbs — one of the methods cited below reads at 214 nm. It is cheap, fast, robust and it is what most purity percentages come from. What it measures directly is absorbance over a separation, which becomes a percentage only after you decide what counts as an impurity and how much each impurity responds relative to the main component.
The limit of UV quantification for peptides is well documented. Conibear, Daly and Craik compared gravimetric, UV-based and NMR-based quantification for small cyclic disulfide-rich peptides of roughly 14 to 29 amino acids and found that these peptides are hard to quantify by the methods routinely used for large proteins, because their small size and limited number of chromophore-containing amino acids work against them. Their conclusion was blunt: gravimetric and UV absorbance methods should be used with caution for small peptides, and all methods should be carefully validated. Their own recommendation was to compare the analytical reverse-phase HPLC trace or UV absorbance at 214 nm against a standard peptide solution quantified by amino acid analysis.
Two consequences follow. First, a UV purity figure is a statement about relative response, and equal response factors for every impurity are an assumption unless somebody measured them. Second, a purity percentage is meaningful only next to the detection limit and the set of impurities the method was looking for. A chromatogram sees what separates on that column at that gradient. Everything else is a flat line at the baseline, indistinguishable from nothing.
For what that looks like in practice on a certificate rather than in a paper, the store’s other research page, how to read a peptide certificate of analysis, is the companion to this one. This page is about the methods; that one is about the document.
Mass spectrometry — identity, sequence and the impurities that co-elute
Mass spectrometry answers a different question. Instead of “how much absorbance in this peak”, it asks what the molecular weight is. Zeng and colleagues built an LC-HRMS method for peptide drug quality control using salmon calcitonin, bivalirudin and exenatide as model systems, and it is a fair picture of what a modern LC-MS panel establishes. Calcitonin and its related impurities gave linear responses from 0.1 to 10 µM, with R² values of 0.995, 0.996 and 0.993 for salmon calcitonin, Glu(14)-calcitonin and acetyl-calcitonin. Intra-assay precision as relative standard deviation was below 10 % at all tested concentrations. Accuracy exceeded 85 % when 0.1, 0.3 and 1 % of the two impurities were spiked into stock calcitonin solution. Detection limits were 0.02, 0.03 and 0.04 µM for the three species, which in their system meant an impurity present at less than 0.1 % of the API concentration of 107 µM could be detected.
Their summary of the advantage is the sentence to remember, because it is the reason MS gets asked for separately: LC-HRMS can also determine amino acid composition, confirm peptide sequence, and quantify impurities even when they are co-eluting, within a single experiment.
That is a real step up from UV. It is not the end of the story, and the second paper on this page shows why.
Two-dimensional LC-MS — the part where a number can lie
Compounds with the same mass-to-charge ratio are, in the blunt phrasing of Petersson and colleagues, not readily differentiated by mass spectrometry, and therefore must be separated chromatographically. Their work develops a 2D-LC-MS strategy for assessing main-peak purity in pharmaceutical peptides, with both dimensions in reversed-phase mode and specific attention to isomer selectivity, screening 30 column and mobile-phase combinations for general separation performance and isomer selectivity using forcibly degraded peptides and mixtures of synthetic diastereomers; a ranking of more than 300 UV and MS chromatograms informed the recommendation.
Read that as a caution rather than a result. Isomers, sequence variants, oxidation products and certain truncations can share a mass and separate — or fail to separate — depending entirely on the column chemistry and gradient chosen. A single-dimension LC-MS method that has not been designed for isomer selectivity can report a main peak as pure while an isomer sits underneath it. This is the technical reason behind the practical rule that a purity number is only as good as the method that produced it.
Capillary electrophoresis — cheap, orthogonal, different bias
Capillary electrophoresis is the second separation technique, and the 1993 review by Rabel and Stobaugh is still the cleanest statement of its role in pharmaceutical analysis. Its potential uses for peptides and proteins range from purity assessment and structural confirmation to micropreparative work. CE carries its own artefacts: preventing protein and peptide adsorption to the capillary wall needs extreme pH values, surface-modified capillaries, high ionic strengths, or zwitterionic surfactants in the background electrolyte. The review’s framing is the useful part — CE and HPLC are complementary, each with different selectivity.
The reason a lab might add CE to a panel is that a result an orthogonal method fails to reproduce is information. Agreement between two separations with different physics is stronger evidence than either alone.
The counterion question — a different method entirely
Nothing above identifies the salt. A peptide can be chemically flawless and still carry an unexpected counterion, and no amount of UV or MS work on the peptide itself will report that, because the counterion is a separate species.
The European Pharmacopoeia’s laboratory department established a generic approach for exactly this, described by Ilko and colleagues: a mixed-mode chromatography method with charged aerosol detection that separates 25 commonly used pharmaceutical counterions, validated for specificity, repeatability, limits of quantification, linearity and range according to ICH guideline Q2(R1) and the Ph. Eur. Technical Guide for the Elaboration of Monographs. The authors demonstrated its applicability for counterion identification and quantification in drug substances and for the control of inorganic ions as impurities, using Ph. Eur. reference standards and other samples including cloxacillin sodium and somatostatin, and noted that for identification of the parent substance and of organic ions the chromatographic system can be coupled to a mass selective detector without modification.
That is what a real counterion determination looks like: a dedicated, validated, separate method with its own reference standards.
Why one test and a panel cost different amounts
Now the commercial question, which the literature answers by arithmetic rather than by price list. The methods above are not variations on one measurement. They are separate, separately validated procedures, each with its own standards and its own instrument time: a reversed-phase HPLC-UV purity trace, an LC-HRMS identity and impurity panel, a capillary electrophoresis orthogonal check, a counterion determination, plus methods this page has not covered — residual solvent analysis by gas chromatography, endotoxin testing, water content. Any one of them can be ordered alone. The more of them a report contains, the more separate validated procedures were run, and the price follows the count. A cheap purity figure is a cheap figure partly because it is looking at one thing.
The preparation this page uses as its worked example is a copper-binding tripeptide, GHK-Cu 100 mg, which is a fair illustration of why method choice matters at the analytical end: peptides with a small number of chromophore-containing residues are exactly the case the analytical literature singles out as one where gravimetric and UV quantification need validation.
What the data do not show
None of this certifies a vial we supply. No purity percentage, assay value or identity confirmation appears anywhere on this site for any product, because none has been published for the batches behind them and the store does not print a figure that was not measured. It also does not show that a purity percentage predicts what a compound does: purity and evidence are separate questions, and a clean chromatogram answers the first one only. And nothing here is a statement about the material inside a specific sealed vial, which requires that vial’s own batch documentation.
Research use only. This page summarises published analytical chemistry for research reference. It is not a specification, not a claim about any supplied product, and not a suggestion for human use. Nothing we supply is for human or veterinary use.
References.
- Zeng K, Geerlof-Vidavisky I, Gucinski A, Jiang X, Boyne MT 2nd. Liquid chromatography-high resolution mass spectrometry for peptide drug quality control. AAPS J 2015;17(3):643-651. PubMed record (PMID 25716148).
- Petersson P, Buckenmaier S, Euerby MR, Stoll DR. A strategy for assessing peak purity of pharmaceutical peptides in reversed phase chromatography methods using two-dimensional liquid chromatography coupled to mass spectrometry. Part I: Selection of columns and mobile phases. J Chromatogr A 2023;1693:463874. PubMed record (PMID 36841023).
- Conibear AC, Daly NL, Craik DJ. Quantification of small cyclic disulfide-rich peptides. Biopolymers 2012;98(6):518-524. PubMed record (PMID 23203757).
- Rabel SR, Stobaugh JF. Applications of capillary electrophoresis in pharmaceutical analysis. Pharm Res 1993;10(2):171-186. PubMed record (PMID 8456063).
- Ilko D, Nap CJ, Holzgrabe U, Almeling S. Validation and application of an HPLC-CAD-TOF/MS method for identification and quantification of pharmaceutical counterions. Pharmeur Bio Sci Notes 2014;2014:81-91. PubMed record (PMID 25655245).